| comments |
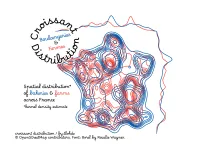
v3. of this idea. Pardon the way I have inadvertantly butchered the lovely cursive font by bending it around a circle such that there are now gaps between each character. Sorry. The choice to use a kernel density estimate is purely aesthetic, a straightforward contour plot, or heatmap would be more appropriate, and I did try these, even log-scaled, but the sheer number in Paris rendered the rest of country dull and empty by comparison. And this is another one that is effectively showing population density by another name.
|
